

Keep the fill ledger intact#
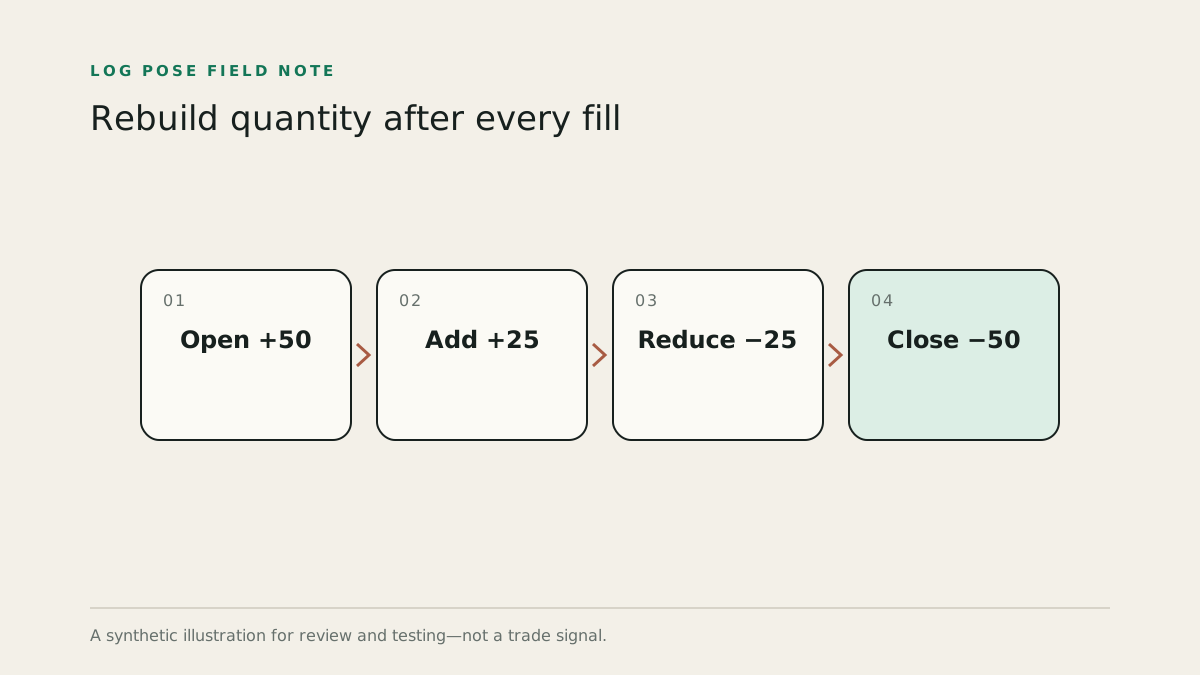
An order for 100 shares can execute as several fills. The brokerage position may summarize them with one average cost, but the journal should preserve each execution:
| Time | Side | Quantity | Price | Running quantity |
|---|---|---|---|---|
| 10:17:34 | Buy | 50 | $181.40 | 50 |
| 10:19:08 | Buy | 25 | $181.58 | 75 |
| 10:31:12 | Sell | 25 | $182.20 | 50 |
| 10:42:51 | Sell | 50 | $181.05 | 0 |
The first two fills create an average long entry of:
(50 × 181.40 + 25 × 181.58) ÷ 75 = 181.46
Plot the $181.46 average if it helps, but also plot $181.40 and $181.58 at their actual times. The average did not occur as a 75-share execution.
Assign a decision role to each fill#
Every execution should be classified by what it did to the open position:
- open: moved quantity from zero to non-zero;
- add: increased exposure in the same direction;
- reduce: decreased exposure without reaching zero;
- close: returned the position to zero;
- reversal: crossed through zero into the opposite direction.
The role determines the review question. An opening fill asks whether the setup and initial risk were valid. An add asks whether new information justified more exposure and whether total risk remained within the plan. A reduction asks whether the scale-out rule was met. A close asks whether the exit followed the invalidation or management rule.
Do not hide a chase inside the average#
Suppose the planned entry zone ended at $181.44. The first fill at $181.40 was inside it; the second at $181.58 was not. The final average of $181.46 looks close to plan and can conceal the chase.
Measure each fill's distance from the planned level. You can express it in dollars, percentage, ATR, or R, but choose the measure before comparing trades. For example:
fill distance in ATR = (fill price − planned price) ÷ ATR at decision time
Use the ATR value available then, not a later daily value.
Recalculate risk after additions#
Initial risk is not automatically fixed when quantity changes. If the invalidation remains at $180.90:
- first fill risk:
50 × (181.40 − 180.90) = $25.00; - second fill adds:
25 × (181.58 − 180.90) = $17.00; - combined open risk before costs:
$42.00.
If the plan allowed only $30, the second fill broke the risk rule even though the average entry moved only six cents above the intended zone. Review dollars at risk, not only average price.
If the stop changed before the add, preserve the time of that change and the rule that authorized it. Do not retrofit a tighter stop merely to keep calculated risk under the limit.
Handle timestamps and corrections honestly#
Orders and activities can have different coverage and time precision. Deduplicate records using stable provider identifiers where possible—not symbol, date, and rounded price alone. Two legitimate partial fills can share those visible values.
If an execution is later corrected or canceled, retain the correction lineage so the final position reconciles to the broker statement. A silent overwrite makes it impossible to explain why a prior journal result changed.
When only daily activity exists, do not distribute aggregated quantity across attractive intraday candles. Review quantity and P&L at daily resolution and mark chart sequencing unavailable.
Review partial exits as management decisions#
For the example, the 25-share sale at $182.20 and 50-share sale at $181.05 produce different realized legs. Do not judge the first as good because it was profitable and the second as bad because it lost.
Ask instead:
- Was the first scale-out level defined before it was reached?
- Did the remaining stop follow a stated rule?
- Did the partial exit improve or damage the strategy's average payoff over many matched trades?
- Did the scale-out change behavior on the remaining position?
A chart with every fill lets you answer those questions. One entry and one exit marker cannot.
Run a reconciliation check#
For any episode with partial fills:
- sum signed quantities after every event;
- confirm the episode ends at exactly zero, within supported fractional precision;
- recompute weighted entry and exit averages;
- compare gross realized P&L with the broker record;
- add fees separately;
- investigate any difference rather than rounding it away.
Only after reconciliation should the episode enter setup statistics. The chart can be beautiful and still be wrong by one missing fill.
Sources and methodology#
Product details and workflows can change. Links below are the primary references checked for this page; the analysis and operational definitions are Log Pose’s.
- Finding your reports and statements — Robinhood
- Account Data: Orders and Activities — SnapTrade
Log Pose is not affiliated with Robinhood, Inner Circle Trader, or the products discussed on this page. This material is for education and recordkeeping, not investment advice. Historical and hypothetical results do not predict future performance.