
First decide which replay you need#
“Replay my trade” can describe two different workflows.
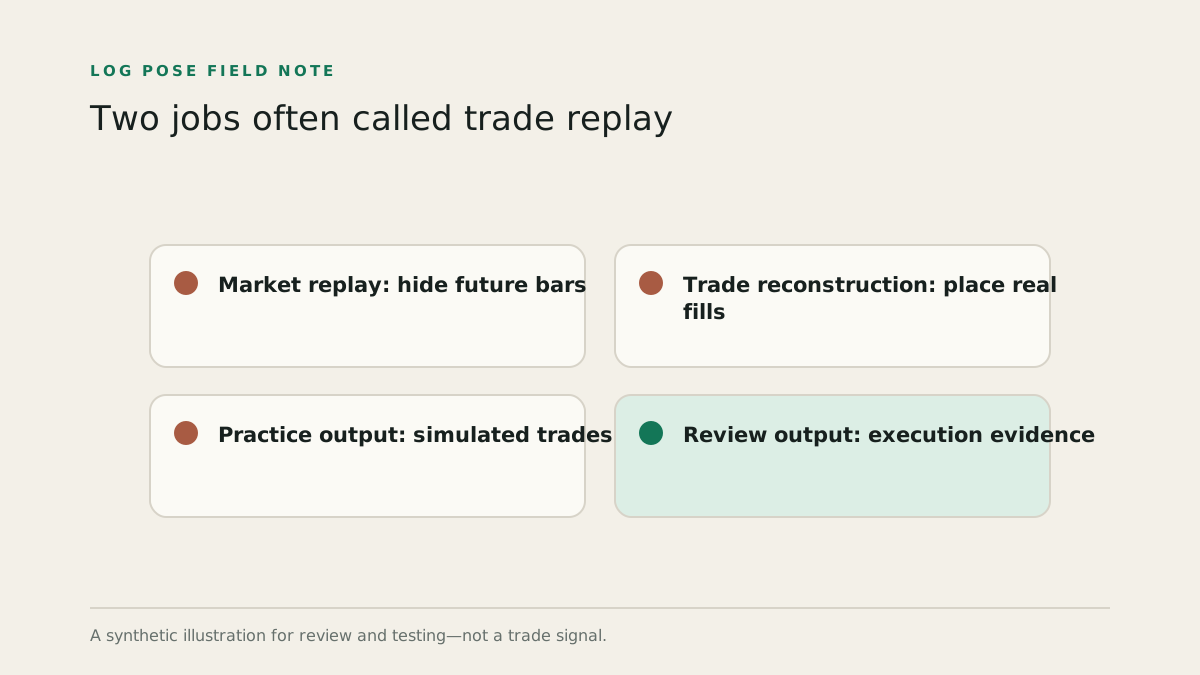
Market replay starts with historical price data, hides the future, and lets you place simulated orders as candles unfold. It is useful for practice and backtesting.
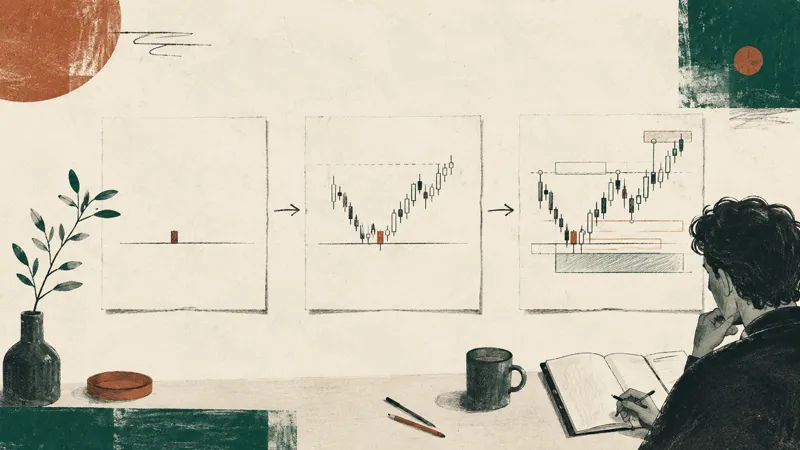
Trade reconstruction starts with a completed broker record. It places the actual entries and exits on the historical chart, then restores the structure surrounding those decisions. It is useful for review.
The difference is the source of truth. In market replay, the simulated action belongs to the replay tool. In reconstruction, quantity, price, and time must come from Robinhood or the authorized connection. A visually convincing marker is not acceptable if it cannot be tied to a real fill.
What a reconstruction can show#
With complete execution timestamps and compatible historical bars, a post-trade replay can show:
- every opening, adding, reducing, and closing fill;
- the open quantity after each execution;
- the weighted average entry as the position changes;
- prior swing levels and the active session range;
- structure candidates confirmed by each point in time;
- the distance between the intended level and the actual fill;
- how the trade evolved after entry without collapsing it into final P&L.
This makes questions concrete. Instead of “I think I chased,” you can measure the second entry's distance from the planned level in dollars, ATR, or R. Instead of “there was a sweep,” you can check whether the prior low was actually established and whether price closed back through it before the fill.
What it cannot recover#
A reconstruction cannot read your mind. It cannot know the level you planned if you never recorded it. It cannot infer initial risk from the amount eventually lost. It cannot prove why you clicked buy.
It also cannot create missing broker precision. SnapTrade documents a practical distinction: order data can be more precise but cover a shorter window, while activity history can extend further but may be daily or lack an intraday time. When only a date is available, the correct replay is a session-level or daily record—not an invented candle.
Other limits matter:
- historical bars can differ by data source, session setting, and corporate-action treatment;
- split or symbol-change dates can make unadjusted comparisons invalid;
- a market order's quote context is not fully recoverable from candle bars alone;
- an average fill does not reveal the order-book path between partial executions;
- replay cannot establish causation between a chart pattern and the result.
Reconstruct in event order#
Use a ledger before drawing the chart:
| Time | Event | Quantity change | Open quantity |
|---|---|---|---|
| 10:17:34 | Buy fill | +50 | 50 |
| 10:19:08 | Buy fill | +25 | 75 |
| 10:31:12 | Sell fill | -25 | 50 |
| 10:42:51 | Sell fill | -50 | 0 |
The position returns to zero at 10:42:51, so the episode ends. Place those four events on the chart individually. You may also display the weighted average, but never in place of the fill sequence.
Then compute structure only from bars confirmed by each event time. If the 10:15–10:20 candle is still open at the second fill, its final high, low, and close are future information.
Use replay to test the decision boundary#
A good replay pauses at points where the decision could have changed:
- immediately before the first fill;
- before each add;
- when the original invalidation is touched;
- before each discretionary exit;
- at the flat position.
At every pause, write what information was available and what the rule required. This exposes whether the decision changed because price supplied new information or because P&L became uncomfortable.
For an ICT setup, the review might ask:
- Was the liquidity sweep confirmed before entry?
- Did the structure break close beyond the buffered level?
- Was the displacement candle closed?
- Did the FVG meet the minimum size before the retrace?
- Was the stop placed beyond the prewritten invalidation?
These questions are useful even when the answer is no. Replay is an audit tool, not a machine for making every trade fit a setup.
When market replay should come next#
After reconstructing several real trades, market replay can test the revised rule on unseen historical sessions. Keep the two datasets separate. Your real trades measure your execution and behavior; simulated trades measure how a stated rule behaves under replay assumptions.
If the rule came from reviewing a particular group of trades, do not report performance on those same trades as independent validation. Define the rule on one sample, then test it on a later or otherwise held-out sample. Include spread, slippage, session, and entry assumptions.
The sequence is simple: reconstruct what you did, define what should change, then replay the new rule somewhere it has not already been optimized.
Sources and methodology#
Product details and workflows can change. Links below are the primary references checked for this page; the analysis and operational definitions are Log Pose’s.
- Account Data: Orders and Activities — SnapTrade
- Learn to trade on historical data — TradingView
Log Pose is not affiliated with Robinhood, Inner Circle Trader, or the products discussed on this page. This material is for education and recordkeeping, not investment advice. Historical and hypothetical results do not predict future performance.